How to Check Server Load on a Windows Server. One of the important tasks for server management in hosting companies is monitoring the server load. Server load monitoring and ensuring that the server load is not too high ensures hosting managers that the hardware is in good condition and prevents downtime.
In this article, we examine how to find the load on the server and, while familiar with this concept, provide solutions for managing it.
While there are many tools and options available, we focus on our Windows VPS Task Manager as a means to help us quickly see what is going on, and interact with applications, processes, and services to identify the load.
Table of Contents
How to Start the Windows Task Manager
– The first way: Click the Start menu and type task manager then choose it.
– The second way: Right-click the Taskbar area and choose Task Manager from the menu.
– The third way: Press Ctrl+Alt+End keys on the keyboard when in a Remote Desktop session.
– The fourth way: Run the command taskmgr.

How to Check Server Load on a Windows Server
Let’s look at what the Task Manager has to offer.
You can click More details to discover more information on this window.
The Task Manager provides quick access to Processes, Performance, Users, Details, and Services.
We’ll go through each tab to see what they have to offer and discover what to look for when checking server load.
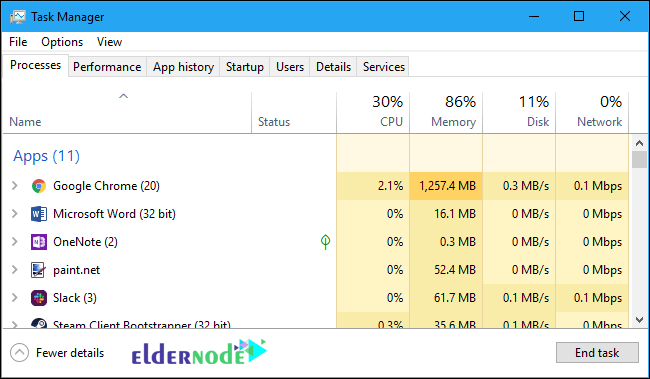
1) Processes Tab
The Processes tab shows us everything that is running in the system and the amount of CPU and memory resources it is using.
At the top, you can see the total CPU and memory utilization.
By clicking the CPU or Memory column headings, you can sort the processes list by that criteria. You can also use the sort arrow to determine whether to sort from highest to lowest usage or the opposite.
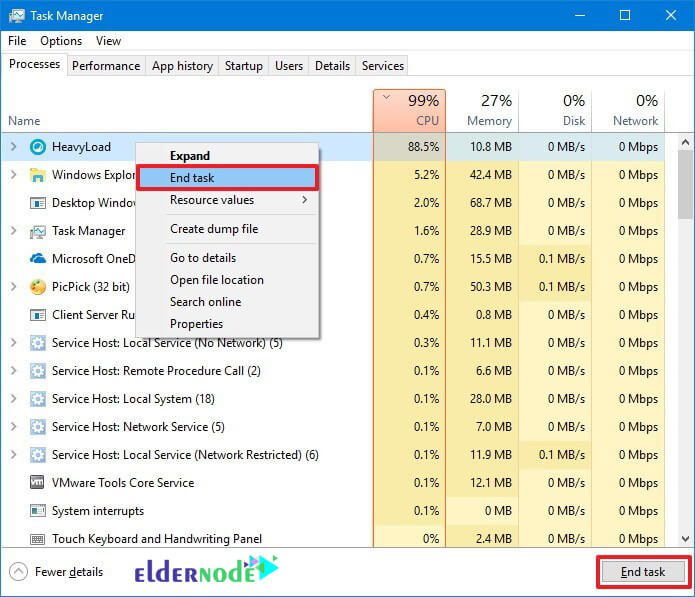
You can click on any individual process and end the task, see resource usage, and more.
2) Performance Tab
The performance tab has the most visual display of information and allows you to select from CPU, Memory, and Ethernet views to show activity over a 60-second period.
With this view, you can identify spikes or see the trend over time to determine if a condition is temporary or sustained.
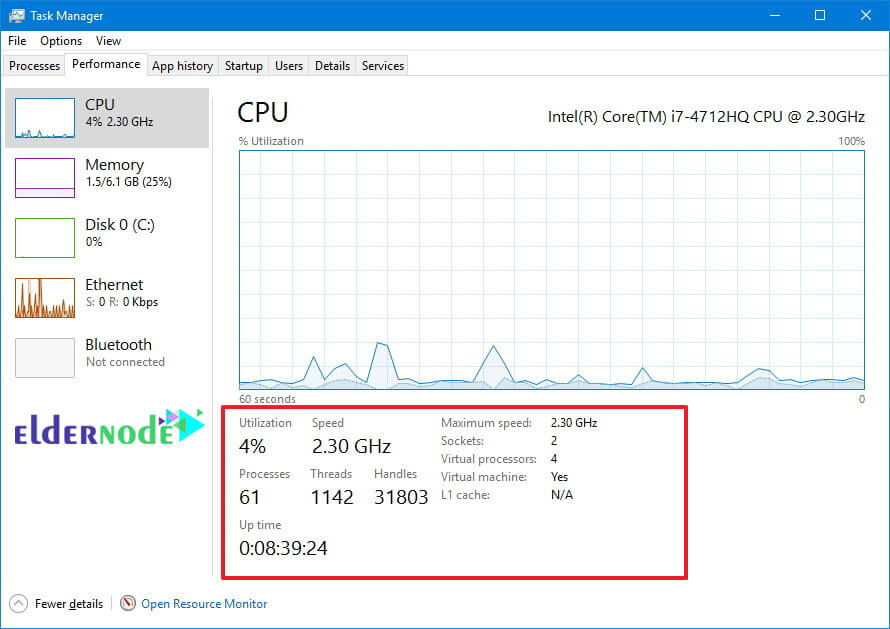
CPU Performance
CPU performance information shows you the type of CPU and speed, the number of processes, threads, and handles in use, as well as the number of virtual CPUs, in most cases.
You can also see how long the system has been up (uptime).
This last bit of information can tell you how long the server has been running, confirm if it successfully completed a restart, or if it rebooted unexpectedly due to running out of resources.
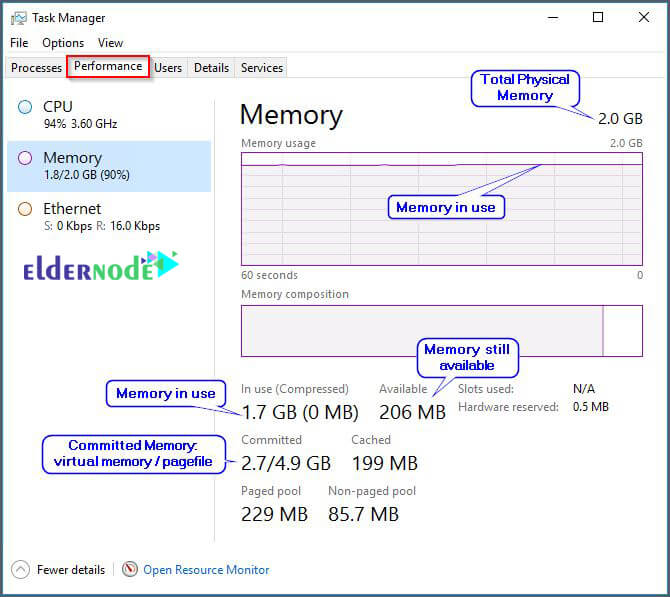
Memory Performance
Memory Performance information shows you the total amount of memory in the system as well as what is in use and available.
Committed represents virtual memory and the pagefile (an extension of RAM) on disk.
Cached represents memory used by Windows, and the Paged pool represents memory used by Windows that can be paged out to the pagefile on disk if memory starts running low.
Non-paged cannot be paged to the pagefile.
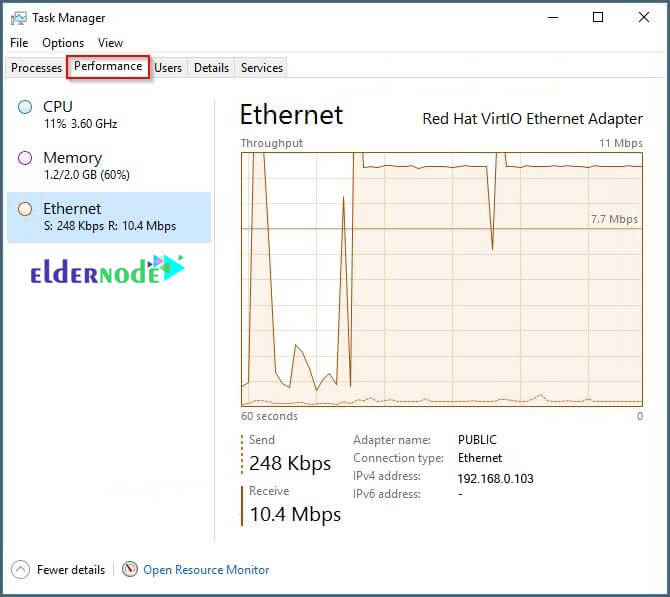
Ethernet Performance
Ethernet performance information shows you the type of network adapter as well as the number of resources it is using with a graphed line for both outbound and inbound traffic, as well as numeric values for the data being sent.
You can also see the Adapter name, Connection type, and the IP address(es) assigned.
Right-clicking on the graph will allow you to see network details including network utilization, link speed, state, bytes send and received, etc.
On the Performance tab, you also have the option to launch Resource Monitor to see even more detail.
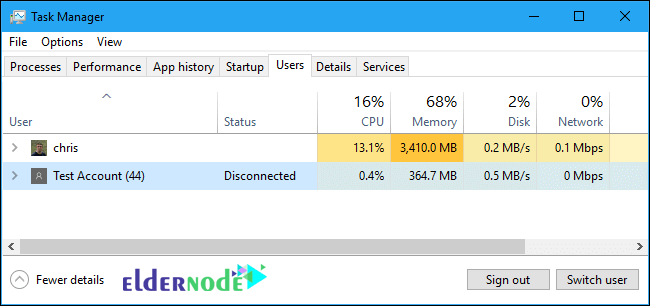
3) Users Tab
The Users tab shows you a list of all the users connected to the server and how much CPU and memory resources the user is utilizing.
You can click on a specific user to Disconnect them, send them a message, or take over their session if we have Administrator rights.
In the context of checking for load, you can determine if a specific user is consuming too many resources or has disconnected from a session, leaving it running in memory, and choose whether to log the user out to free up resources.
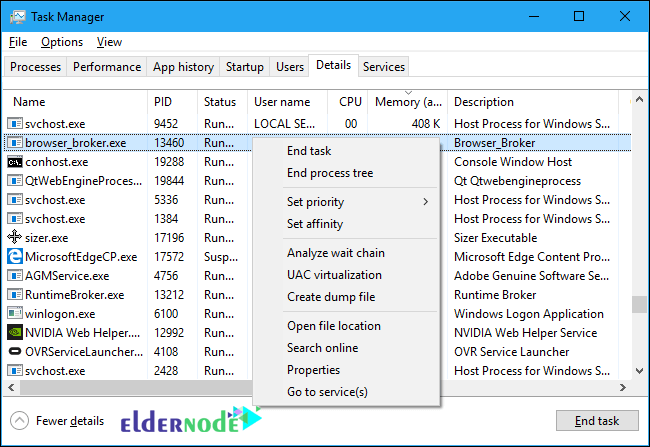
4) Details Tab
The Details tab shows you a list of all the running programs and processes along with their PID (Process ID) number, whether the program is running or suspended, the user name it is running under, the amount of CPU and memory it is using, and a description of the process.
You can click any of the column names to sort by that column in highest to lowest or the opposite order.
The PID number can be very helpful to track down a specific process that is referenced in event logs.
Right-clicking an item allows you to choose options including:
– ending a process or process tree
– set a priority for the running process
– establish affinity to a specific processor or all processors
– additional options
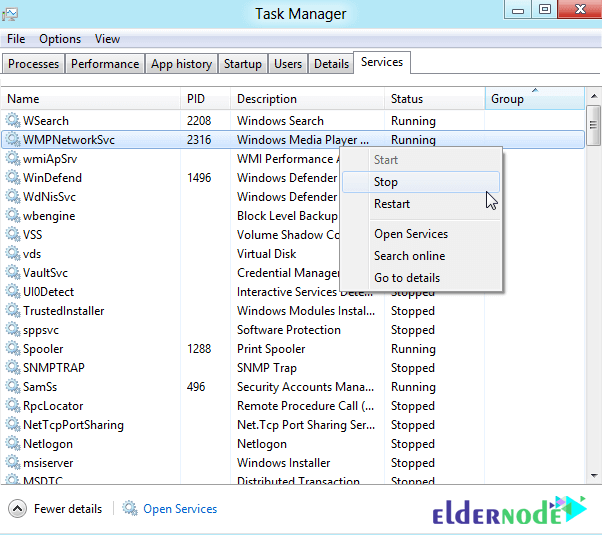
5) Services Tab
The Services tab shows you a list of service names, their PID (Process ID) numbers, a description of the service, the status as either stopped or running, and the Group the service is running under.
Right-clicking on service allows you to start, stop, restart, and access additional options.
You should be careful not to change the status of some services as they depend on others, and stopping the wrong one could have unintended consequences on the system or devices.
To learn more about a service, you can right-click it and choose Search Online.
How to Check Server Load on a Windows Server
Ways to start Resource Monitor
– Click the Start menu and type resource monitor then choose it.
– Right-click the Taskbar area and choose Task Manager from the menu.
Then from Performance tab choose Open Resource Monitor.
– Run the command resmon.
The overview provides you with data on CPU, Memory, Disk, and Network options and graphs all on one page with the option to expand or collapse each section.
It will also show the current usage of a resource as well as the highest active time.
Clicking individual sections provides more detail.
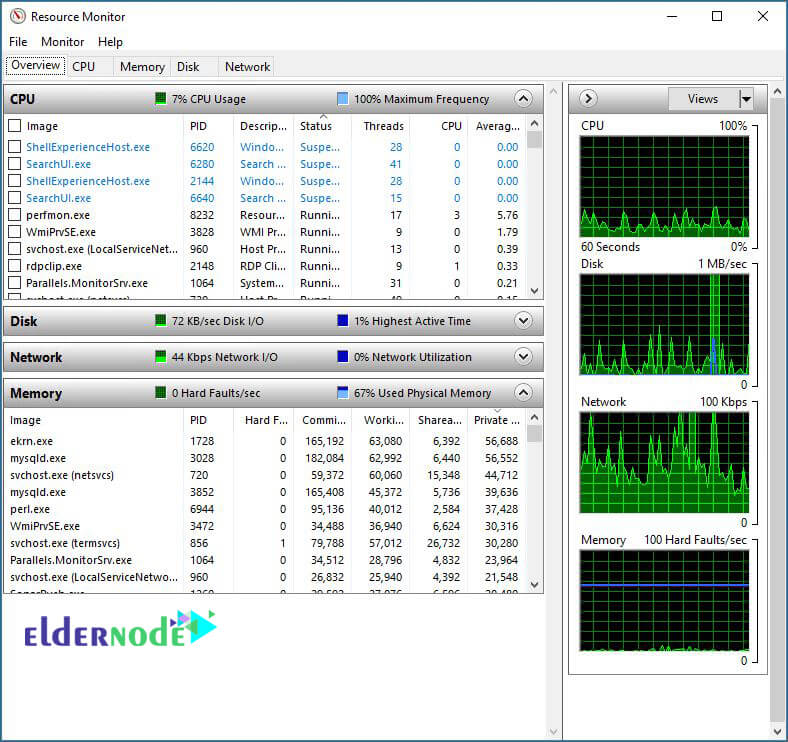
A. CPU shows processes, services, associated handles, and modules, and will show individual CPUs and their load in addition to total CPU.
B. Memory shows processes in addition to a breakdown of the physical memory and graphs to show commit charge which relates to the use of the pagefile and the number of hard faults per second which can be an indicator of how many times Windows has to access the swap file.
Note: If your system is showing hundreds of hard faults per second, this indicates a need for more physical memory.
C. Disk shows the processes in addition to a breakdown of how much each task is reading and writing to disk.
The graphs show total disk activity in addition to Queue Length.
Disk Queue length indicates how many disk I/O operations are queued up waiting for their turn to be processed by the disk.
If you find that the highest active time is above 80% and the disk queue length is 2 or higher, it means processes are waiting, and the performance of the disk is affecting the overall performance of the system.
In many cases, this number will be high due to a system that lacks sufficient physical memory and is constantly paging information to disk or relying too heavily on virtual memory. It will often be accompanied by a CPU running above 90% for sustained periods.
D. Network shows the processes with network activity, in addition to TCP connections and listening ports, and graphs to show network transfer and TCP connections.
Sustained high network utilization can indicate congestion issues and a need for more capacity.
Choose your perfect Windows Virtual Private Server Packages in Eldernode
Dear user, we hope you would enjoy this tutorial, you can ask questions about this training in the comments section, or to solve other problems in the field of Eldernode training, refer to the Ask page section and raise your problem in it as soon as possible. Make time for other users and experts to answer your questions.
How to Check Server Load on a Windows Server.
Goodluck.