How to Monitor Bandwidth and Traffic on MikroTik RouterOS


Last updated: August 2025
Want to monitor traffic on your MikroTik RouterOS but not sure where to start? Been there. Whether you’re managing a home lab or a VPS server, getting real-time bandwidth info can be super helpful especially if you’re dealing with bottlenecks or want to trigger alerts.
In this guide, I’ll show you how to set up traffic monitoring using Winbox, step-by-step. I’ve done this setup on a MikroTik VPS before if you’re looking for one, Eldernode has some solid options.
What is Mikrotik RouterOS?
MikroTik RouterOS is a lightweight, Linux-based operating system developed by MikroTik for routing, firewall, bandwidth management, and network automation. It’s designed to run on MikroTik’s own RouterBoard hardware or on standard PCs. If you’re using a MikroTik VPS, chances are it comes with RouterOS pre-installed.
Why MikroTik Works Well for Traffic Monitoring
Honestly, one thing I like about MikroTik is how light and fast it is. Doesn’t eat up much CPU or RAM, and just… works. You don’t need some fancy hardware to monitor traffic or run scripts. I’ve had it running fine on a basic VPS and it held up just great.
Official Resource
For more details on MikroTik RouterOS and advanced configuration options, you can visit the official MikroTik documentation:
👉 https://help.mikrotik.com/docs/
Monitoring Traffic on Mikrotik RouterOS
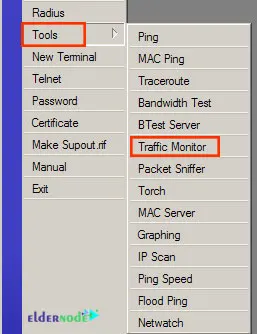
At first, open Winbox and click on Tools and then select Traffic Monitor:
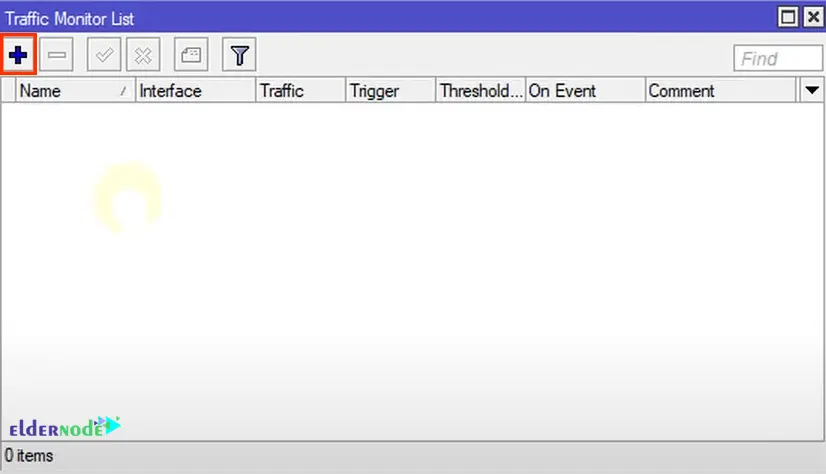
Click the plus icon to define a new traffic rule that fits your setup.
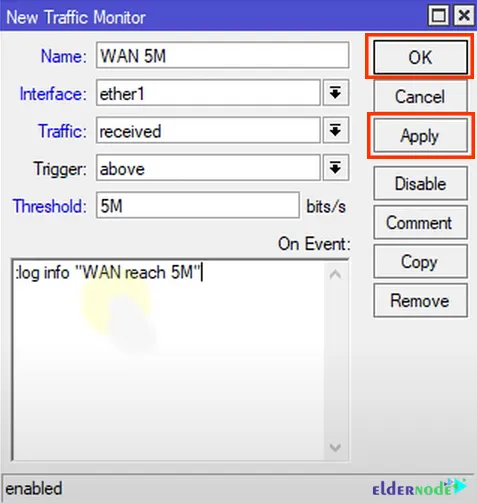
You can call it what you want. We called it WAN 5M. Whenever your one connection reaches five megabits per second which is Ethernet 1 will trigger.
The Traffic section has to do with upload or download. Transmitted is actually uploaded and received is download.
Now you can set the Trigger section to say whenever it goes Above, Always, or Below.
The Threshold section is the actual value that you want to set. If you are going to set your one connection to be five megabits, you should just type 5M.
Whenever you are receiving traffic on Interface Ethernet one that is above five megabits per second do Event. In the Event section, you can write a script or you can call another script that is written before:
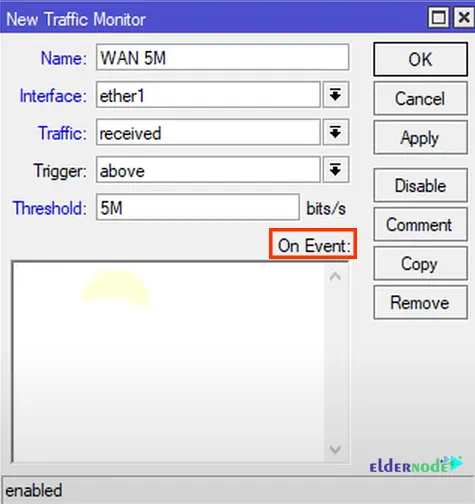
In the event section, we will put log info “WAN reach 5M”. When the five megabits are going through the Ethernet one, it will activate the arm script. Finally, click on Apply and then OK:
You can see your script in Traffic Monitor List:
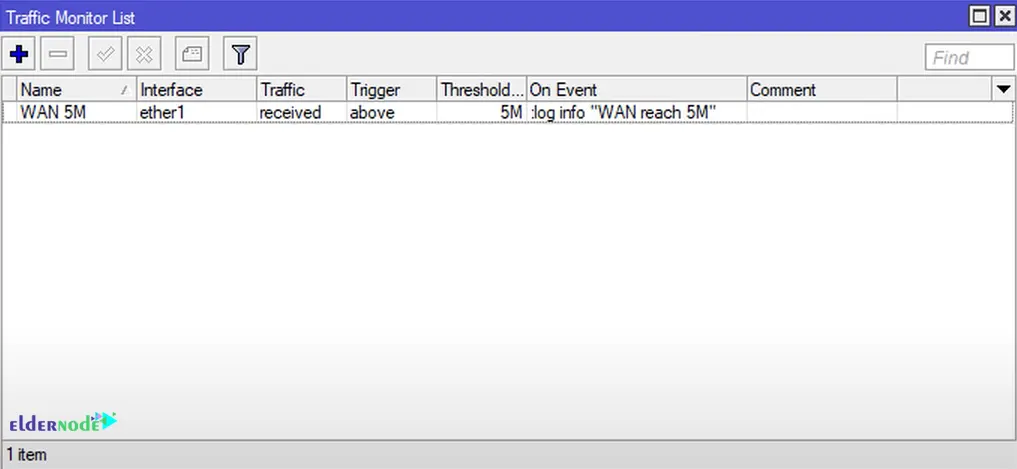
If the interface reaches five megabytes each time, it activates on the Event. Typical letters on the traffic monitor feature work.
That’s it! You can write a script to switch to another interface or recreate the road possibilities endlessly.
Pro tip: If you want to monitor multiple interfaces, you can clone the rule and change the interface target. Just make sure your threshold isn’t too low, or you’ll flood the logs.
Conclusion
I didn’t think traffic monitoring on MikroTik would be this straightforward. But yeah just a few clicks, set a trigger, add a line or two, and it’s done.
I tried this on a VPS I got recently, mostly because I didn’t want to mess with my home setup. It worked right out of the box.
Anyway, if you’re messing with something similar and it breaks or behaves weirdly been there. Leave a note or something, maybe I’ve hit the same issue before.
Also, if you need a clean VPS with MikroTik pre-installed, I used Eldernode. No complaints so far.